
Giving cash is the effective way to help
lift people out of extreme poverty.
Trusted by 170,000+ donors and evaluators like Charity Navigator and
Charity Watch, we efficiently deliver the maximum share of each gift
directly to families in poverty. We're committed to transparently showing
(through research and real stories) how cash empowers people to
improve their own lives.
Giving cash is
Help someone transform their life.
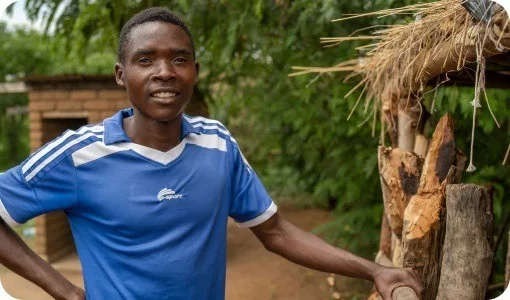
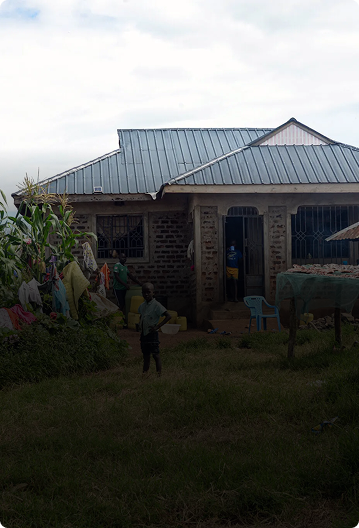
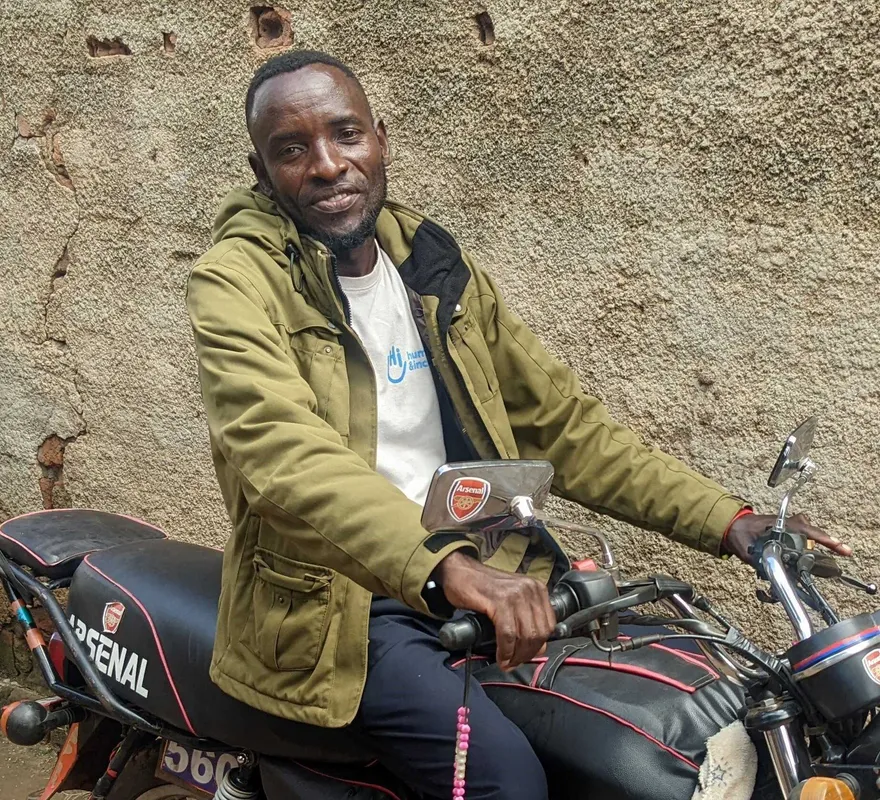
Ndiwo’s parents couldn’t afford to send him to high school. With $197, he was able to re-enroll and buy farm equipment. He’s saving the profits to study engineering at a university.
Help without conditions.
People in poverty deserve the dignity to choose for themselves how best to improve their lives — cash enables that choice.
Help that works – and lasts.
There are 300+ studies on cash transfers – making it one of the most-studied aid interventions. Cash has been shown to drive a range of impacts, even 5+ years after a transfer.
Help that is efficient and direct.
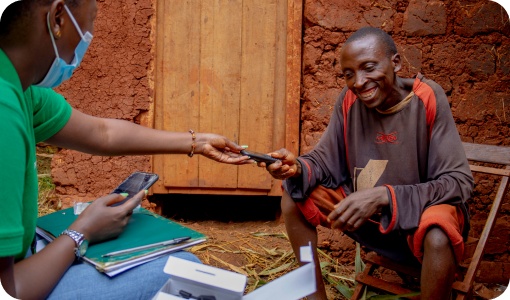
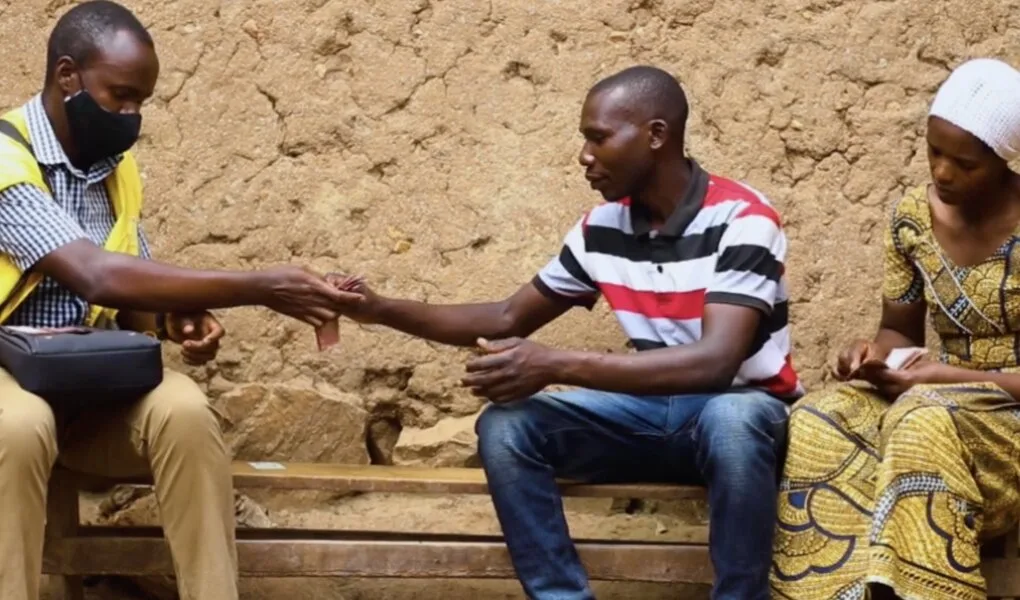
Cash has no shipping costs: your donation is delivered directly to a person in poverty via mobile money with support from in-country staff, not subcontractors or middle-men.
Help end extreme poverty.
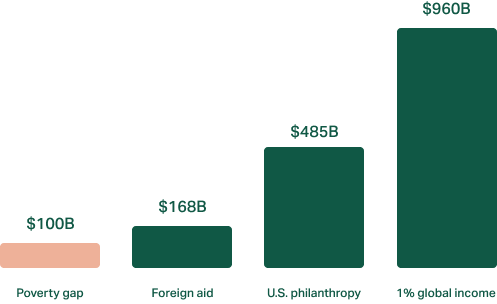
The resources to close the poverty gap for 700M+ people already exist – they’re just not reaching those in greatest need. Unlike other forms of aid, cash can efficiently scale to reach and transform hundreds of millions of lives.
Read independent reviews and real-world coverage of our work
“Giving $1,000 to poor families lowered infant mortality rates by nearly half, and deaths in children under 5 by 45 percent… The decline in infant mortality is a ‘show-stopping result.’”
Read more →“This simple model is disrupting the traditional charity sector by cutting out the NGO middle man.”
Read more →The Most Innovative Nonprofits of 2026
Read more →“Why billionaires like MacKenzie Scott and Jack Dorsey are donating millions to this nonprofit that gives cash to the poor”
Read more →“[GiveDirectly’s] investment in fast payment technologies. . . is a large part of how quickly they can deliver donations directly to recipients.”
Read more →“GiveDirectly uses a rigorous, data-driven model to oversee the entire transfer process end-to-end — without a middleman or partner charity.”
Read more →Trusted by top funders and researchers
2,141,627 people reached
Explore highlights from the field
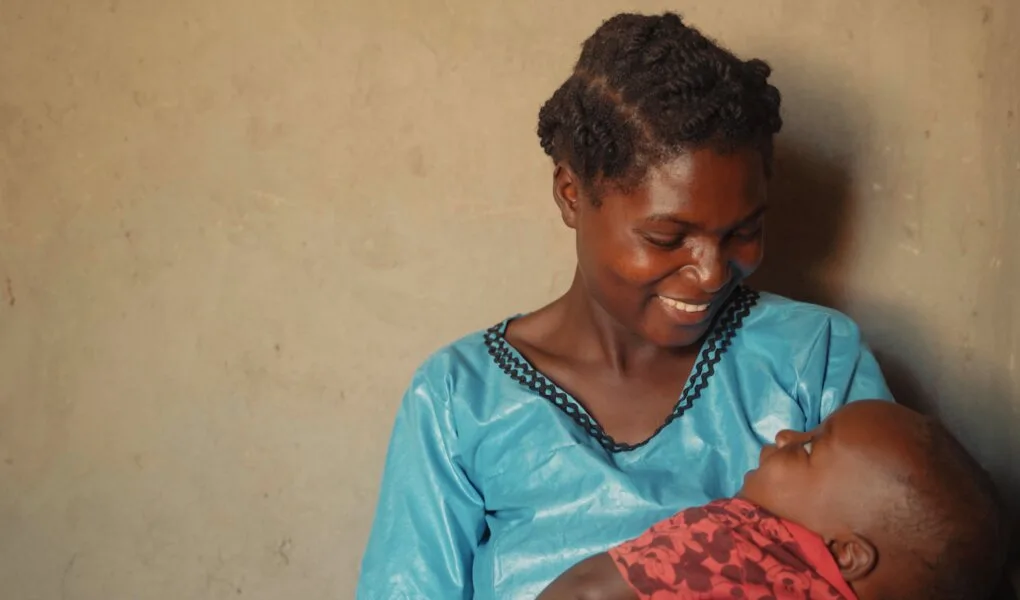
Study: Giving cash to mothers cut infant deaths in half
A randomized study in Kenya found that giving families a $1,000 GiveDirectly cash transfer cut infant deaths by 48%, and now GiveDirectly is launching a new program with a Kenyan community health provider to deliver cash to more expectant mothers and maximize these life-saving impacts.
Switching to more cash aid would help millions in 2025
Maximizing the portion of humanitarian aid given as cash from 20% to 50% could mean directly helping ~2.7 million more people this year without spending more.
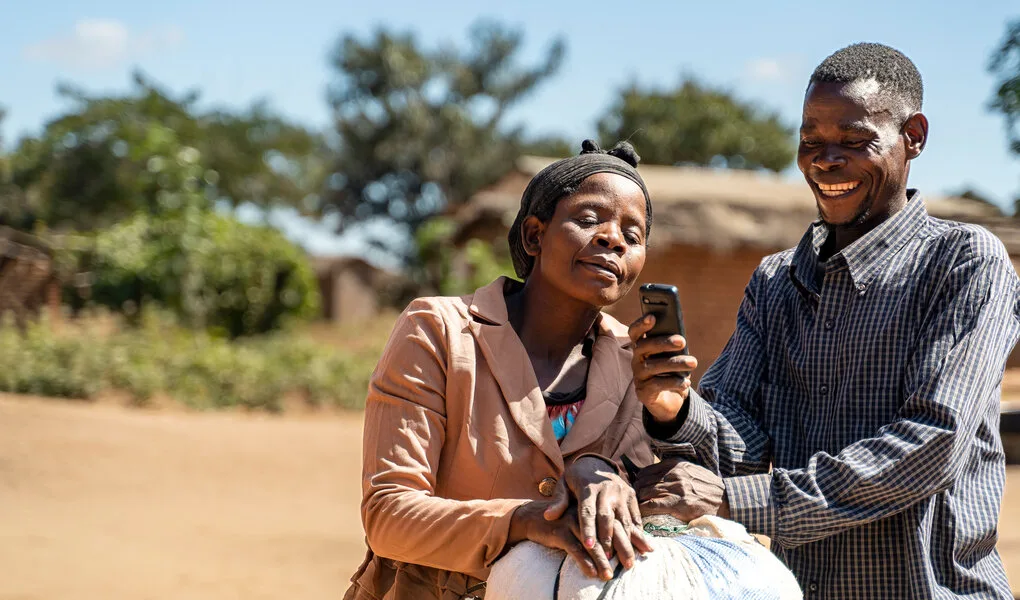
Explain AI/ML systems to people in poverty using real-world scenarios
GiveDirectly collaborated with researchers and local teams to refine how we explain our AI-driven payment system, finding that scenario-based examples resonate best with recipients.
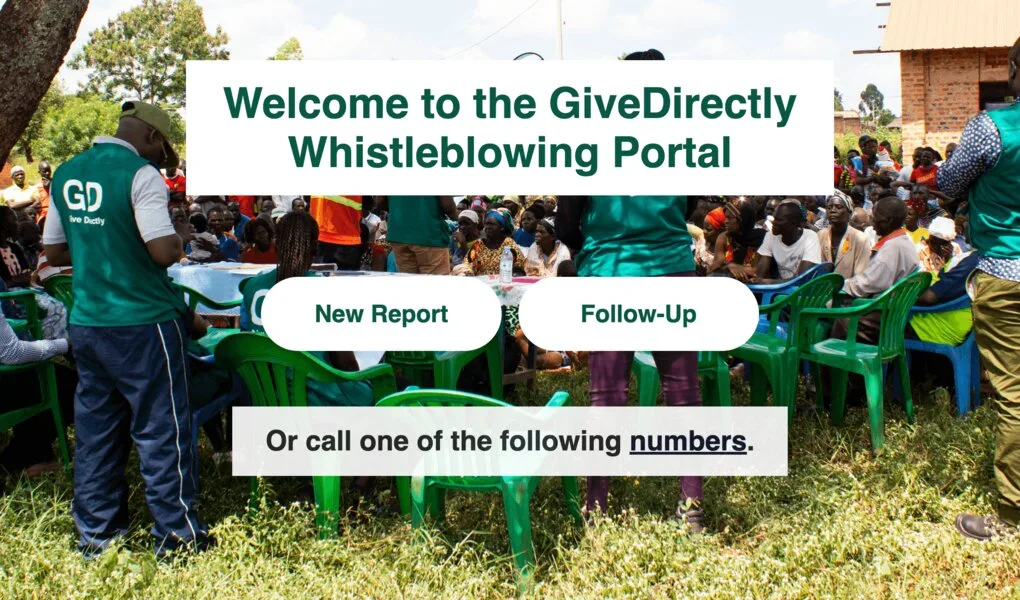
How GiveDirectly prevents, addresses, and reports risks
GiveDirectly publishes an annual report on fraud, harm, and safety incidents, reflecting our increased investment in safeguarding and commitment to transparency.
More people in poverty get cash when we work with governments
GiveDirectly is partnering with the governments of Malawi and Rwanda to run cash transfer programs integrated with both countries' wider development plans, creating a path to accelerating the end of extreme poverty.
Early findings from the world's largest UBI study
We worked with researchers to compare the impacts of a short-term UBI vs. long-term UBI vs. lump sum transfer. These results look at just the first two years, when all three groups had received roughly the same amount of money.
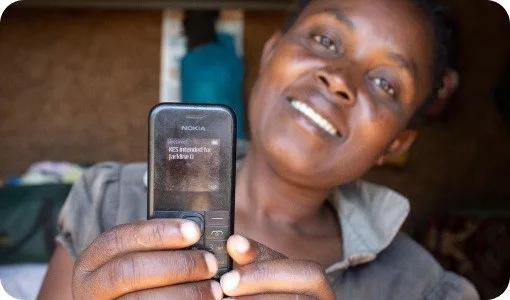
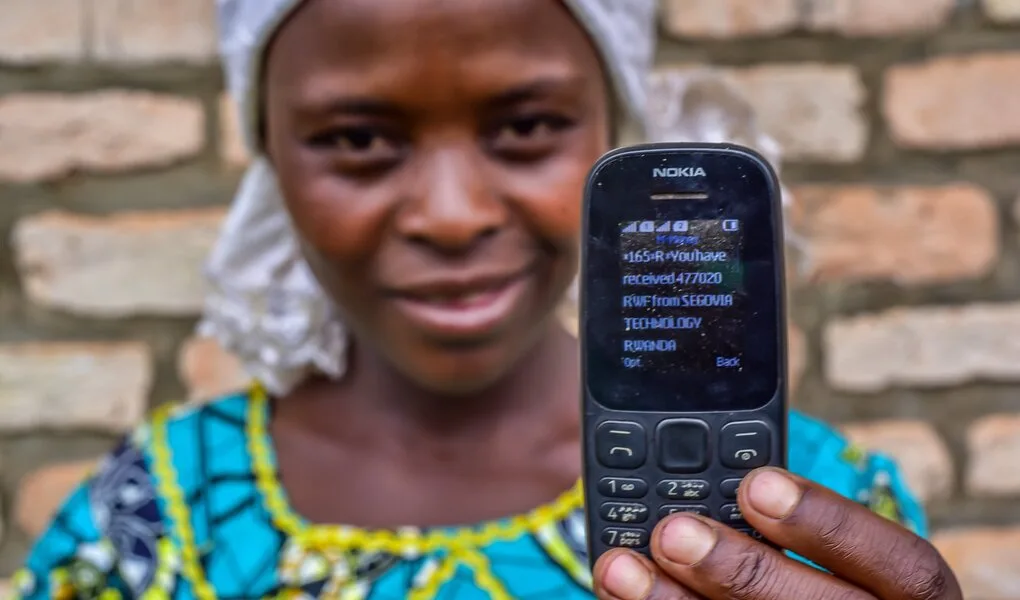
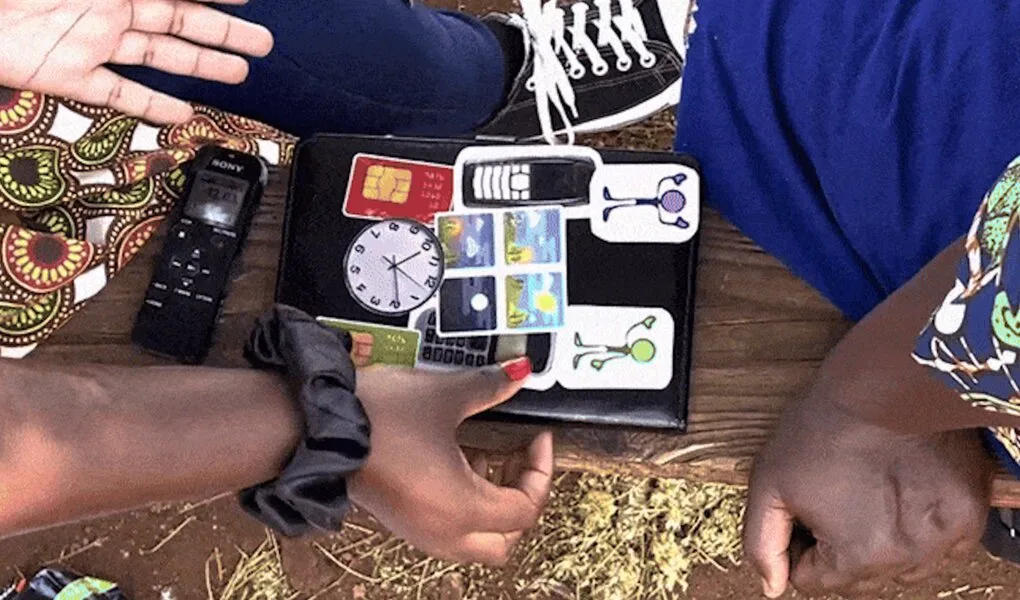
The power of getting a mobile phone
16% of Africans do not live within reach of a mobile network, with the biggest gaps in the poorest regions due to a lack of demand. Our project reaching 15K families in Kiryandongo, Uganda motivated two telcos to extend coverage and mobile money agents to the area…
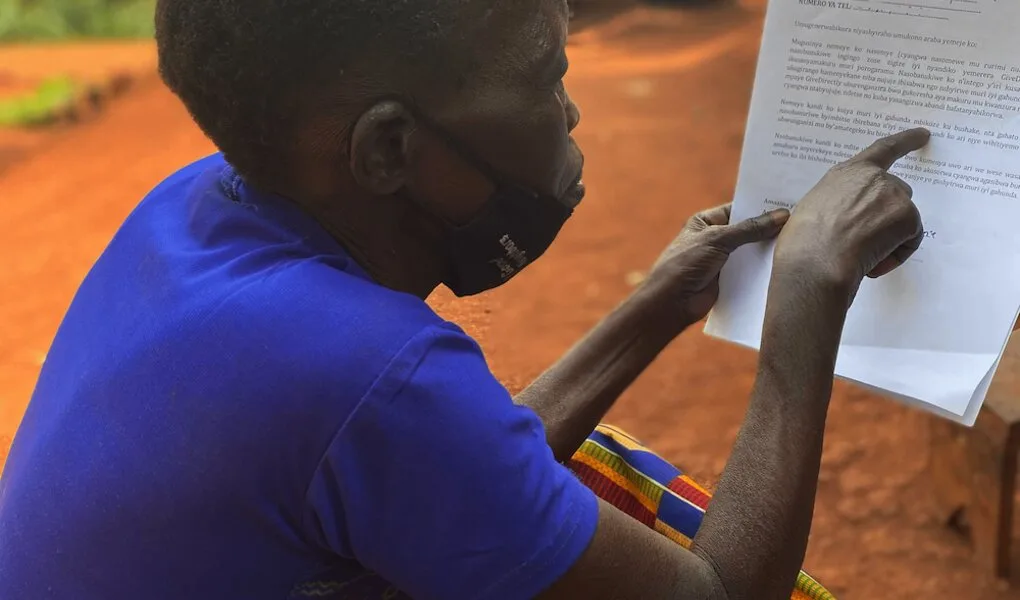
Sharing stories of poverty but not 'poverty porn'
People in poverty are often documented without their consent. GiveDirectly only documents recipients with their formal consent, or in the case of minors, both their and their parents' consent. They opt to sign a plain-language form translated into local languages…