Our latest research in 4 sentences:
Over the course of 3 payments in 4 months, GiveDirectly delivered $1,000 to 3,415 households in coffee growing communities. One year later, we surveyed them to measure their economic well-being and coffee production. Recipients of the cash consumed more, earned more, had more assets, and greater food security. Also, coffee farmers invested more in their coffee farms and sold more coffee.
Stepping back: research at GiveDirectly
In addition to learning from others’ research on cash transfers, GiveDirectly regularly evaluates its own programs. We use these evaluations to improve the design, targeting, and execution of our cash transfer programs, as well as to answer questions about their effects. This research typically falls into three categories, each with their own advantages and limitations
- Operational measurement & piloting: GiveDirectly surveys all our recipients at least 4 times each and seeks feedback from a subset of recipients many more times. We use this data to understand and quantify different aspects of our operational performance, from how fast we enroll recipients to how well they understand our programs. These metrics help us understand how operational changes affect the quality of a program’s execution, and we complement them with research from randomized trials to better understand a program’s impact.
- Internal research studies: In these projects, GiveDirectly will manage the research and synthesize the results. These studies incorporate good research best practices (randomization, pre-registration) where feasible, while enabling us to move faster, and focus on questions we and funders are interested in, typically at a lower cost than external studies.
- External research studies: We also participate in a number of research projects where the management and execution of the research is led entirely externally. These are our costliest studies, but produce the most rigorous results.
What we did
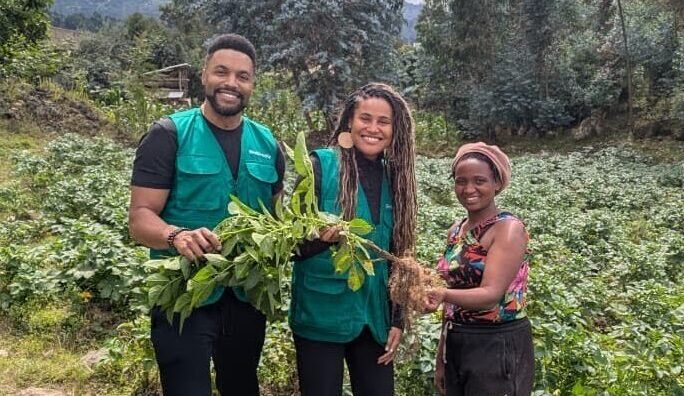
In 2016, Benckiser Stiftung Zukunft (BSZ) asked GiveDirectly to measure how poor coffee farmers spend cash grants. Together, we decided to pursue a hybrid of the internal and external evaluation approaches described above, partnering with researchers at IDinsight. We chose a group of villages in Eastern Uganda where 30% of households grew at least some coffee. After pre-registering the experiment and pre-analysis plan, GiveDirectly paid the poorest 20% of households in each village as well as a random subset of households that were between the 21st and 64th poverty percentiles in each village. Each household received $1,000 total or about $2,828 adjusting for purchasing power in Uganda (“PPP”).
12-15 months later, we surveyed both cash receiving and non-cash receiving households and enrolled the remaining control households to also receive cash transfers. GiveDirectly team members conducted the surveying, researchers at IDinsight monitored the data collection for quality and conducted the analysis, and GiveDirectly wrote the final report with comments from IDinsight and BSZ.
What we found
The full report is available here, but we’ve summarized the key results below, showing changes in purchasing power adjusted terms (PPP) and percentage change.
- Both coffee farmers (defined as farmers reporting selling coffee recently at baseline) and non-coffee farmers reported significant improvements in the 4 primary measures of economic well-being we studied: they consumed $99 more per month (PPP), earned $27 more (PPP) , and had considerably more assets (+$3524, PPP) and greater food security (+0.47 standard deviations).
- Coffee farmers invested more in their coffee farms. Our index of multiple types of coffee investments increased by 0.69 standard deviations, reflecting higher rates of pruning, stumping, mulching, and weeding, as well as increased spending on new land, sacks, pesticide, fertilizer, and coffee transportation. On average, coffee farmers also sold $17 more (PPP) in their last coffee harvest, driven by being more likely to produce coffee and expanding the area of land under cultivation.
- Coffee was typically only one of many ways these farmers made money, so the increases in investment and revenue were small in absolute terms and relative to non-coffee investment and earnings increases, despite representing large percentage gains.

Significance levels: *** p<0.01, ** p<0.05, * p<0.1
Some caveats
Any single study should of course be read in the context of the broader literature, with the specific limitations and setting taken into account. In the case of cash transfers — broadly defined across design, execution quality and targeting — this literature extends to over 160 rigorous experiments. There are other studies of single, large transfers to populations like this one, but very few that we are aware of have focused on coffee farmers and the effects of cash transfers on coffee production.
This study does, however, have its limitations. It’s possible the results found were driven by a factor aside from the cash transfers. In particular, the fact that surveyors were affiliated with GiveDirectly could have biased how people answered our questions. Moreover, the study was not designed to measure whether the control group was affected positively or negatively by being near people who received cash (“spillovers”). In other words, one can only interpret the treatment effects as the differences in how people who received cash and people who didn’t were affected by the project.
Most non-coffee-related results were broadly consistent with the magnitudes found in the Haushofer and Shapiro (2016) study of cash transfers delivered by GiveDirectly in Kenya. There, $1,000 transfers led to similar increases in consumption, food security, and assets excluding housing and land value. Total asset gains in this study were much larger, due to significant increases in the value of housing and land owned (not fully captured in the Kenya study). We know that the gains in land value were at least in part due to recipients valuing each portion of land they own more highly after transfers, but we don’t have a confident explanation for the full magnitude of these increases.
What we learned
A question like “do cash transfers affect coffee revenue?” comes down to whether the people who receive the cash know how to increase their coffee revenue and whether they prioritize doing so.
The results suggest farmers are aware of a variety of ways to improve their farms (we measured statistically significant increases in the rate of pruning, stumping, mulching, and weeding, and spending on new land, sacks, pesticide, fertilizer, and coffee transportation all rose).
The results also suggest that these farmers prioritize those improvements in the context of a portfolio of investments they can make to improve their overall lives. For example, while coffee revenues from the most recent harvest increased $17 PPP, annualized sales of other crops and enterprise income increased by hundreds more. Similarly, overall asset increases were much larger than the money spent on coffee investments.
We applaud BSZ’s decision to use this project to benchmark their other investments in improving the lives of coffee farmers. BSZ can now use these results to ask which other initiatives outperform the direct transfer of capital. This relatively lightweight experiment helped highlight important trade-offs like whether in-kind approaches can deliver comparable or larger increases in coffee revenue and how those gains should be weighed given the priority this type of poor coffee farmer places on them relative to their other livelihoods. We’re looking forward to learning more, and collaborating with more partners like BSZ, the Ray and Tye Noorda Foundation, Unorthodox Philanthropy, and USAID to experiment with different approaches of asking whether the aid sector is doing more good with the money it spends than the poor could do themselves if just given as cash. (broken link changed to archive link on 06/04/2021)